


Table of Contents
- 1. Customer satisfaction does not guarantee loyalty
- 2. The current landscape of customer satisfaction
- 3. Key data on customer satisfaction
- 4. Implications of customer satisfaction for businesses
- 5. The relationship between satisfaction and brand loyalty
- 6. Analysis of the Forbes article on customer satisfaction
- 7. Conclusions on customer satisfaction and its impact
- 8. The importance of customer satisfaction in the telecommunications sector
Customer satisfaction does not guarantee loyalty
- 83% of consumers in the U.S. say they are “happy” with the service, but 42% report more negative experiences than in previous years, an upward trend since 2024.
- For the customer, good service “should be easy”: 74% believe companies can deliver it without major complications.
- Tolerance is limited: 66% say that, even if they like the product, they will leave if the service is not good.
- The standard is no longer set by the direct competitor, but by the best experience the customer has had with any brand.
Satisfaction, retention, and real friction
– “Happy” (high CSAT) does not equal “I’m staying” (retention): a customer may report satisfaction with a recent interaction and still switch providers if repeated friction appears, a one-off bad experience occurs, or a more convenient alternative emerges.
– High averages can hide deterioration: 83% “happy” coexists with 42% reporting more negative experiences; that usually indicates the problem is not “the entire service,” but specific moments in the journey that break frequently.
– The product doesn’t make up for the service (and vice versa): even with a beloved product, 66% leave if service fails; but at the same time, excellent service won’t save a product that doesn’t work.
– Typical operational trade-off: cutting costs with automation or rigid policies can improve internal metrics in the short term, but if it increases customer effort (more steps, more transfers, more waiting), “stated satisfaction” may be slow to drop while churn accelerates.
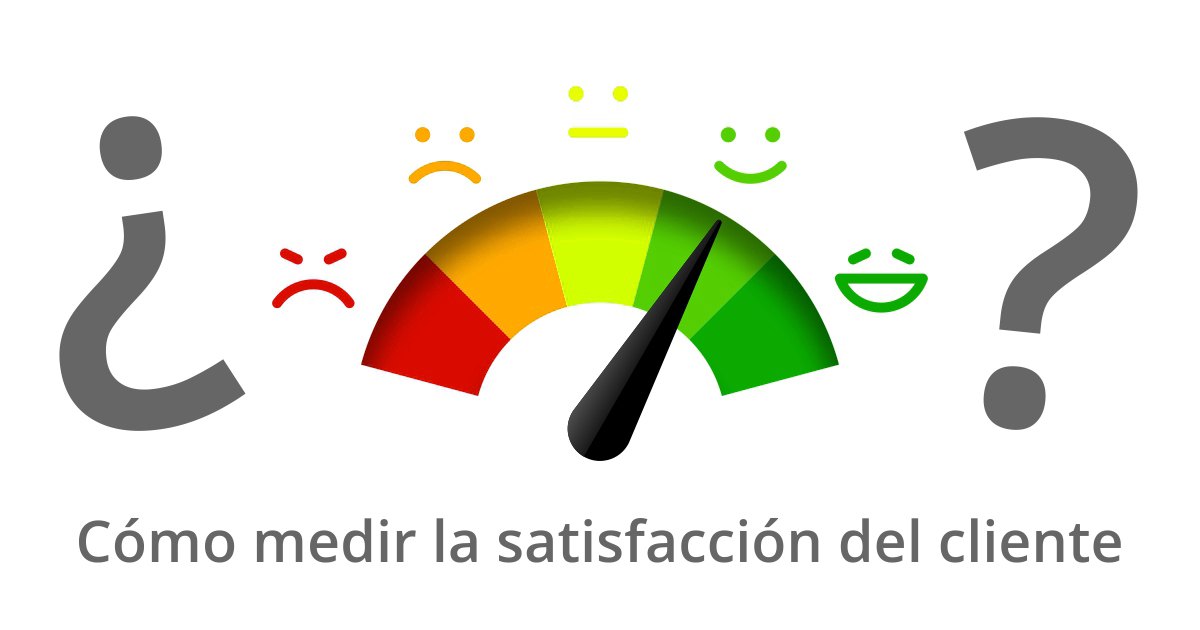
The current landscape of customer satisfaction
Customer satisfaction is living a paradox: aggregated averages may look healthy while the day-to-day experience erodes. In 2026, a large majority say they are happy with the service, but the group that perceives a sustained deterioration in their interactions with companies is growing.
Part of the problem is expectations. In a market where immediacy and digital self-sufficiency have become normalized, customers interpret “good service” as a set of basics: fast response, friendliness, knowledge, and keeping promises. When any of those elements fails, frustration spikes because, from their perspective, it shouldn’t fail.
In addition, the customer experience is only as strong as its weakest link. Service has two components—systems (processes, technology, policies) and people (employees who provide support)—and consumers don’t distinguish who’s at fault: if something breaks, “the brand” failed.
Rising expectations and increasing friction
Two forces explain why “average” satisfaction can look good while friction increases:
– Expectations imported from other industries: the customer compares you with the best experience they’ve had with any brand (not with your direct competitor). That makes the standard moving.
– Digitization that changes the tolerance threshold: when simple tasks (checking, paying, changing, canceling) become self-service across many sectors, any extra step or wait is perceived as “unnecessary.”
– Real heterogeneity by sector and channel: there are industries and touchpoints where improving is harder (e.g., complex support), so it’s best to read these data as trend signals rather than a single verdict on all companies.
Key data on customer satisfaction
Percentage of satisfied customers
The most cited data from Shep Hyken’s 2026 study (based on a survey of more than 2,000 consumers in the U.S., weighted by demographics) paint a mixed picture:
Scope of the data: these figures reflect self-reported perceptions of consumers in the U.S. in 2026 and serve as a trend signal (especially in the 2024–2026 series), rather than as a single diagnostic of performance by industry or company.
- 83% of customers say they are happy with the service.
- 42% say they have had more negative experiences than in previous years.
- That 42% has been rising: 38% (2024), 40% (2025), 42% (2026).
- 74% believe it is easy for companies to provide good customer service.
- 66% maintain that, even if they love the product, if the service isn’t good, they leave.
- In expectations when choosing where to buy: product quality (96%), trust (95%), price (94%), customer service (91%) and convenience (85%).
| Data (U.S., 2026) | What it measures | Quick business takeaway |
|---|---|---|
| 83% | Customers who say they are “happy” with the service | Good “headline,” but not proof ofretention nor absence of friction |
| 42% | Customers with more negative experiences than in previous years | Sign of perceived deterioration at journey touchpoints |
| 38% → 40% → 42% | 2024–2026 evolution of the negative-experiences indicator | Upward trend (worsening) despite high overall satisfaction |
| 74% | Customers who believe providing good service “is easy” | Failures are interpreted as avoidable; low tolerance |
| 66% | Customers who leave if the service is not good, even if they like the product | Service functions as a “condition for staying” |
| 96% / 95% / 94% / 91% / 85% | Hierarchy of expectations (product, trust, price, service, convenience) | Prioritize: product and trust before optimizing service alone |
The business takeaway is uncomfortable: a high satisfaction “topline” can coexist with a persistent increase in frictions, failures, and disappointments that push customers into silent churn.
Trends in customer satisfaction
Two trends stand out for their direct impact on revenue and reputation:
-
Increase in negative experiences despite high overall satisfaction. The 2024–2026 series suggests gradual wear: more customers feel service is getting worse, even if the average still “passes.”
-
Raising the bar through cross-category comparison. Customers no longer compare a company with its immediate rival, but with the best experience they remember—an efficient e-commerce site, an impeccable restaurant, or an exceptional B2B salesperson. That “inter-industry” comparison makes the standard moving and often unattainable if the organization relies only on internal benchmarks.
In parallel, recent sector research points to stagnation or declines in metrics such as NPS across multiple industry-and-country combinations (Forrester, 2025), reinforcing the idea that satisfaction does not improve uniformly and that customer perception is volatile. In other words: there are isolated improvements, but not a homogeneous advance across all markets or sectors.
Implications of customer satisfaction for businesses
Satisfaction is a useful but incomplete indicator. If it is interpreted as synonymous with “low risk,” it can lead to wrong decisions: cuts in customer support, poorly integrated automations, or rigid policies that save costs in the short term and destroy trust in the medium term.
The most direct implications:
- Risk ofcomplacency: the 83% “happy” can hide a real deterioration in the experience, evidenced by the 42% with more negative episodes.
- Service demand elasticity: the 66% willing to leave even if they like the product turns service into a survival factor, not a differentiator.
- Priority of fundamentals: quality and trust appear above “service” itself in stated expectations. An excellent contact center does not make up for a product that fails or a brand that does not inspire credibility.
In operational terms, the message is clear: improving CX is not just “being nice”; it requires coherence across processes, technology, policies, and training. If one fails, the customer experiences it as a single broken experience.
What to measure so satisfaction is actionable: in addition to CSAT, it’s worth tracking operational metrics that often explain perceived friction, such as first contact resolution (FCR) and response and resolution times. The sector research dossier cited in this article highlights these levers as among those most linked to real experience improvements when managed consistently.
Reducing friction in customer service
1) Pinpoint “where it hurts” (not just how much it hurts): cross the 42% of negative experiences with the 3–5 most frequent reasons for contact (e.g., billing, returns, support, cancellations).
– Checkpoint: are there 1–2 reasons that concentrate most complaints or recontacts?
2) Define 2–3 operational metrics that explain the friction:
– FCR (first contact resolution) to measure recontact/transfers.
– Times (response and resolution) to measure waiting.
– Effort (CES or proxy: steps, screens, transfers) to measure “how hard it was.”
– Checkpoint: if CSAT is “fine” but FCR drops or effort rises, you’re buying superficial satisfaction.
3) Prioritize levers with double impact (customer + cost): improving the knowledge base, routing, training, and eliminating policies that generate recontact.
– Checkpoint: does each improvement reduce repeat contacts or transfers, in addition to raising satisfaction?
4) Automate the predictable and protect the complex: self-service for frequent tasks; fast escalation to a human for high-complexity or high-value cases.
– Checkpoint: can the customer “get out of the bot” without penalty (without repeating data, without restarting the case)?
5) Close the loop: each friction spike should end in a concrete change (process, policy, product) and a subsequent verification.
– Checkpoint: can you show what changed and whether recontact dropped in 2–4 weeks?
Loyalty has limits, and in 2026, those limits are more visible. Hyken’s data is compelling: two out of three customers will leave a company if the service doesn’t keep up, even when they like the product.
This reveals a key difference:
- Satisfaction can be a momentary state (“today they treated me well”).
- Loyalty is a repeated decision (“I keep choosing you even though there are alternatives”).
Loyalty requires consistency, reduced effort, and, above all, trust. That’s why satisfaction measured in surveys may not anticipate churn: a customer may say they are “satisfied” and still switch for convenience, price, a recent bad experience, or an alternative with a better perceived standard.
Metrics to predict loyalty
How to read (and combine) metrics so you don’t confuse “satisfaction” with “retention”:
– CSAT (satisfaction): captures the evaluation of an interaction or period. Useful for detecting pain points, but it can be “high” if the customer got lucky or if the questionnaire arrives after a simple case.
– NPS (recommendation): approximates affinity and word of mouth; it can plateau even if CSAT rises if the experience is correct but not memorable.
– CES (effort): approximates friction (“how easy was it?”). It often explains why someone leaves even without being “angry.”
– Churn/retention (behavior): it’s the final outcome. To connect it with CX, look for consistent relationships between churn and operational variables such as FCR, transfers, recontact, and times.
Rule of thumb: if you want to predict loyalty, combine a perception metric (CSAT/NPS/CES) + an operations metric (FCR/times/recontact) + a behavior metric (churn/renewal).
Analysis of the Forbes article on customer satisfaction
The Forbes article by Shep Hyken issues a warning: the headline “83% of happy customers” is, in reality, a signal to worry if interpreted without context. The piece offers three relevant management ideas:
-
Aggregate satisfaction doesn’t capture the friction trend. The growth of negative experiences (38%→40%→42%) suggests that the system is degrading at specific points in the customer journey.
-
The customer believes doing it well is basic. The 74% who consider it “easy” to provide good service implies that failures are perceived as negligence or lack of interest, not as operational complexity.
-
The product doesn’t shield against the
poor service. The 66% who leave even if they like the product dismantles the idea that product differentiation is enough in competitive markets.
Hyken also ranks customer expectations: first that the product works (96%), then trust (95%), then price (94%), service (91%), and convenience (85%). It’s a useful hierarchy for prioritizing investments: before optimizing scripts or response times, you have to ensure quality, transparency, and follow-through.
Paradox in the customer experience
Verifiable points that support the article’s thesis (and why they matter):
– Who and when: Shep Hyken (customer service/CX expert, author and keynote speaker) publishes in Forbes (Feb 22, 2026) results from his “State of Customer Service and CX”.
– How the main data point was obtained: survey in January of more than 2,000 consumers in the U.S., weighted by age, gender, and other demographics.
– The “paradox” in numbers: 83% say they are happy, but 42% report more negative experiences; additionally, the 42% rises from 38% (2024) to 40% (2025) and 42% (2026).
– Direct operational implication: if the customer believes that providing good service “should be easy” (74%), failures are interpreted as avoidable; that raises the reputational cost of each point of friction.
– Business implication: 66% say they will leave if service is not good even if they like the product; therefore, stated satisfaction should not be read as “protection” against churn.
Conclusions on customer satisfaction and its impact
Customer satisfaction remains a valuable thermometer, but it is not retention insurance. In 2026, the data show a two-speed scenario: many customers say they are happy, but the number who accumulate negative experiences increases and their tolerance decreases.
For companies, the practical conclusion is that CX must be managed as a system: a product that works, sustained trust, reasonable policies, simple processes, and trained teams. And, above all, with a less complacent reading of averages: when the standard is set by “the best experience the customer has ever had,” any repeated friction becomes an invitation to switch brands.
The Importance of Customer Satisfaction
Satisfaction matters because it influences repeat purchases, recommendations, and tolerance for mistakes. But its greatest value is diagnostic: it makes it possible to detect where the business is delivering—or failing—on what the customer considers basic.
In 2026, the 83% “happy” figure should not be used as a trophy, but as a starting point to ask: why do the 42%
Do they experience more negative experiences? At what moments in the journey is the promise broken?
Challenges in the Customer Experience
The most frequent challenges are concentrated in execution:
- Misalignment between systems and people: rigid processes or poorly implemented technology leave the agent with no leeway and the customer without a solution.
- High expectations and cross-comparisons: the customer compares against “the best” they’ve experienced, not the industry average.
- Trust as a prerequisite: if the brand does not inspire trust, subsequent service loses effectiveness as a recovery tool.
Strategies to Improve Customer Satisfaction
Three lines of action, consistent with the measured expectations:
- Ensure the fundamentals of the product and the promise: reduce failures, returns, and surprises; communicate clearly.
- Design for ease (less effort): simplify policies, eliminate unnecessary steps, resolve on the first contact when possible.
- Invest in human and operational capacity: training, useful tools for the agent, and processes that allow resolution without “passing the buck”.
The importance of customer satisfaction in the telecommunications sector
Current trends in customer satisfaction
Telecommunications typically operates with a high frequency of contact (billing, incidents, plan changes), which amplifies the impact of small frictions. In this context, tolerance for waits, transfers, and inconsistent responses decreases.
Implications for telecommunications companies
For telcos, satisfaction is not just reputation: it’s churn. If many are willing to leave due to poor service even when they like the product, network quality alone is not enough. The battle is fought in resolution, transparency, and ease of account management.
| Operational lever (contact center) | Typical reported range/benchmark (industry references) | Why it matters in telco |
|---|---|---|
| FCR (first-contact resolution) | Averages around ~70%; “good” 70–79%;“world-class” ≥80% (rare) | Reduces recontact due to incidents/billing and lowers the feeling of “they’re making me run around” |
| ASA (voice response speed) | Common targets 20–40 s | Long waits increase abandonment and worsen perception during incident peaks |
| Call abandonment | Standard ~6%; “good” <5%; top ~3% or less | In telco, abandonment usually turns into recontact and escalation through other channels |
| AHT (average handling time) | Voice guidelines ~4–7 min (varies by reason) | If AHT is reduced at the expense of transfers or recontact, FCR drops and effort increases |
| Occupancy | Typical band mid‑70% to mid‑80%; >85% is considered hard to sustain | Prolonged saturation degrades quality, consistency, and the agent experience |
| Telco churn (industry references) | Reported estimates ~21–31% (varies by market/segment) | Makes small improvements in friction and trust have a meaningful financial impact |
How Suricata Cx can transform the customer experience
In telecommunications, transforming the experience often requires end-to-end visibility: detecting recurring friction points, understanding why they repeat, and closing the loop between what the customer reports and what operations fix. CX-focused platforms like Suricata Cx can provide that bridge between measurement and action, helping prioritize improvements where they most impact satisfaction and retention.
These data show that an 83% “happy” rate can coexist with 42% negative experiences and 66% willing to leave if the service fails. At Suricata Cx, this reading translates into an operational focus for telcos and ISPs: reducing friction, speeding up resolution, and sustaining trust with applied automation and human control where it matters.
This approach prioritizes turning satisfaction signals into operational decisions (automate what’s predictable, escalate what’s complex to humans, and close the loop with integrations), especially in typical telecommunications flows such as billing, incidents, and account management.

Martin Weidemann is a specialist in digital transformation, telecommunications, and customer experience, with more than 20 years leading technology projects in fintech, ISPs, and digital services across Latin America and the U.S. He has been a founder and advisor to startups, works actively with internet operators and technology companies, and writes from practical experience, not theory. At Suricata he shares clear analysis, real cases, and field learnings on how to scale operations, improve support, and make better technology decisions.