


We added a feature to our platform that simplifies data handling
As we prepare for the upcoming National Meeting of Internet Providers, which will take place next week at the Costa Salguero Convention Center in Buenos Aires, we continue updating the features of our Suricata Cx 3.0 tool with changes aimed at streamlining and improving the efficiency of customer service management.
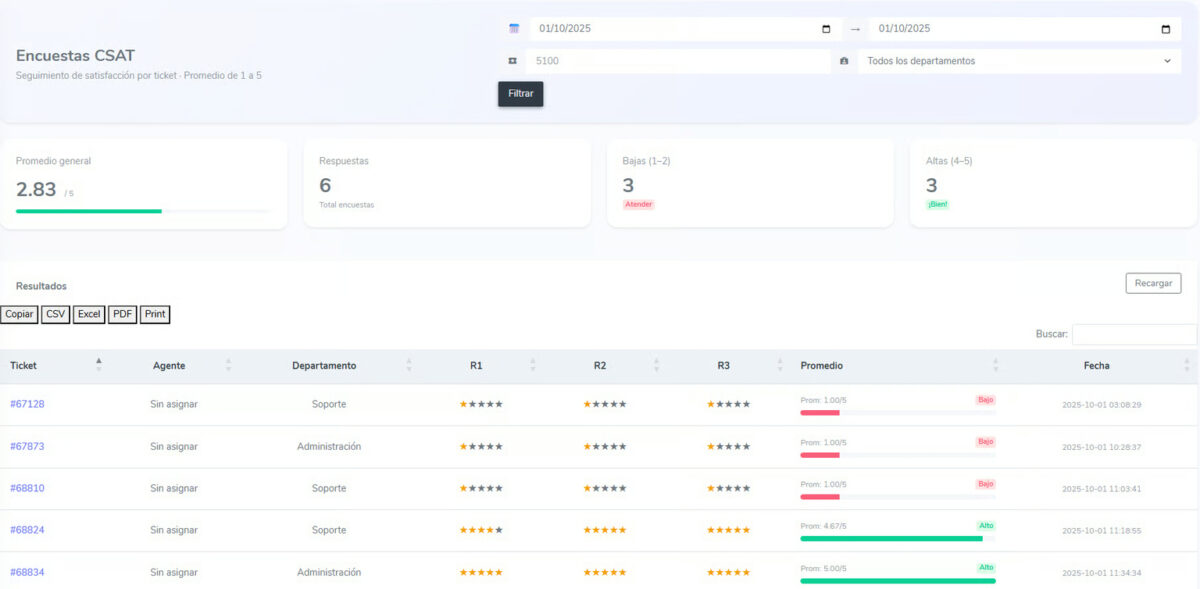
In this regard, there is a new Dashboard view for CSAT surveys. To access it, you must go to the Settings section, where the CSAT Report is available. This report enables better tracking and analysis of customer satisfaction surveys.
At that point, the information can be filtered by date range, ticket number, or department, thus obtaining a more accurate and segmented analysis of the results.
Likewise, once the filter is applied, the following indicators will be displayed at the top:
- Overall average: average of all surveys (scale from 1 to 5).
- Responses: total number of surveys answered in the filtered period.
- Low (1–2): number of surveys with a low rating (dissatisfied customers).
- High (4–5): number of surveys with a high rating (satisfied customers).
In addition, in the lower area a table with the individual surveys in spreadsheet format is displayed. There, each row corresponds to a ticket and contains the following information:
- Ticket number: with a direct link to the ticket on the platform.
- Agent who handled that ticket (if assigned).
- Department or area to which the ticket belongs.
- Responses (R1, R2, R3): score for each of the survey questions.
- Average: overall average of the three responses.
- Date and time: moment when the survey was answered.
Finally, the collected information can be exported in different formats (CSV, Excel, or PDF).
If you want to know more about Suricata Cx 3.0, don’t hesitate to contact us.

Martin Weidemann is a specialist in digital transformation, telecommunications, and customer experience, with more than 20 years leading technology projects in fintech, ISPs, and digital services across Latin America and the U.S. He has been a founder and advisor to startups, works actively with internet operators and technology companies, and writes from practical experience, not theory. At Suricata he shares clear analysis, real cases, and field learnings on how to scale operations, improve support, and make better technology decisions.